
Keyword
Earth Science | Biological Classification | Protists | Plankton
41 record(s)
Type of resources
Topics
Keywords
Contact for the resource
Provided by
Formats
Update frequencies
Status
draft
-
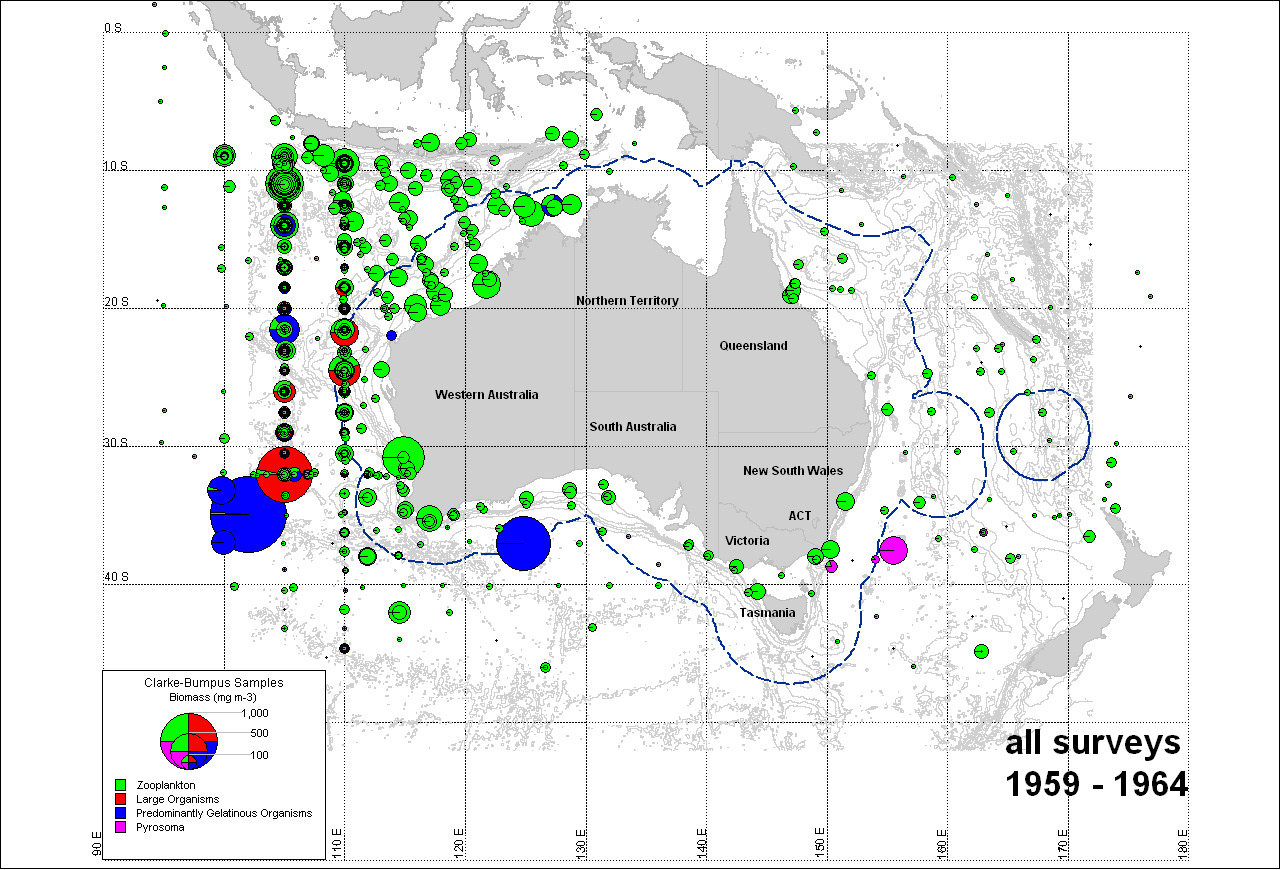
Map of zooplankton biomass in Australian waters. Data collected from oceanographic surveys conducted between 1959 and 1964 onboard the vessels "Gascoyne" and "Diamantina" using a Clarke-Bumpus Oblique Haul, with zooplankton biomass expressed in milligrams per cubic metre. These maps have been produced by CSIRO for the National Oceans Office, as part of an ongoing commitment to natural resource planning and management through the 'National Marine Bioregionalisation' project.
-
Zooplankton biomass point data that has been mapped using MapInfo along 110ºE, Indian Ocean using a standard net (samples from return-trips along the 110ºE latitude line were shifted to 105ºE). These MapInfo layers have been produced by CSIRO for the National Oceans Office, as part of an ongoing commitment to natural resource planning and management through the 'National Marine Bioregionalisation' project. Variations in onscreen colour representation or printed reproduction may affect perception of the contained data.
-
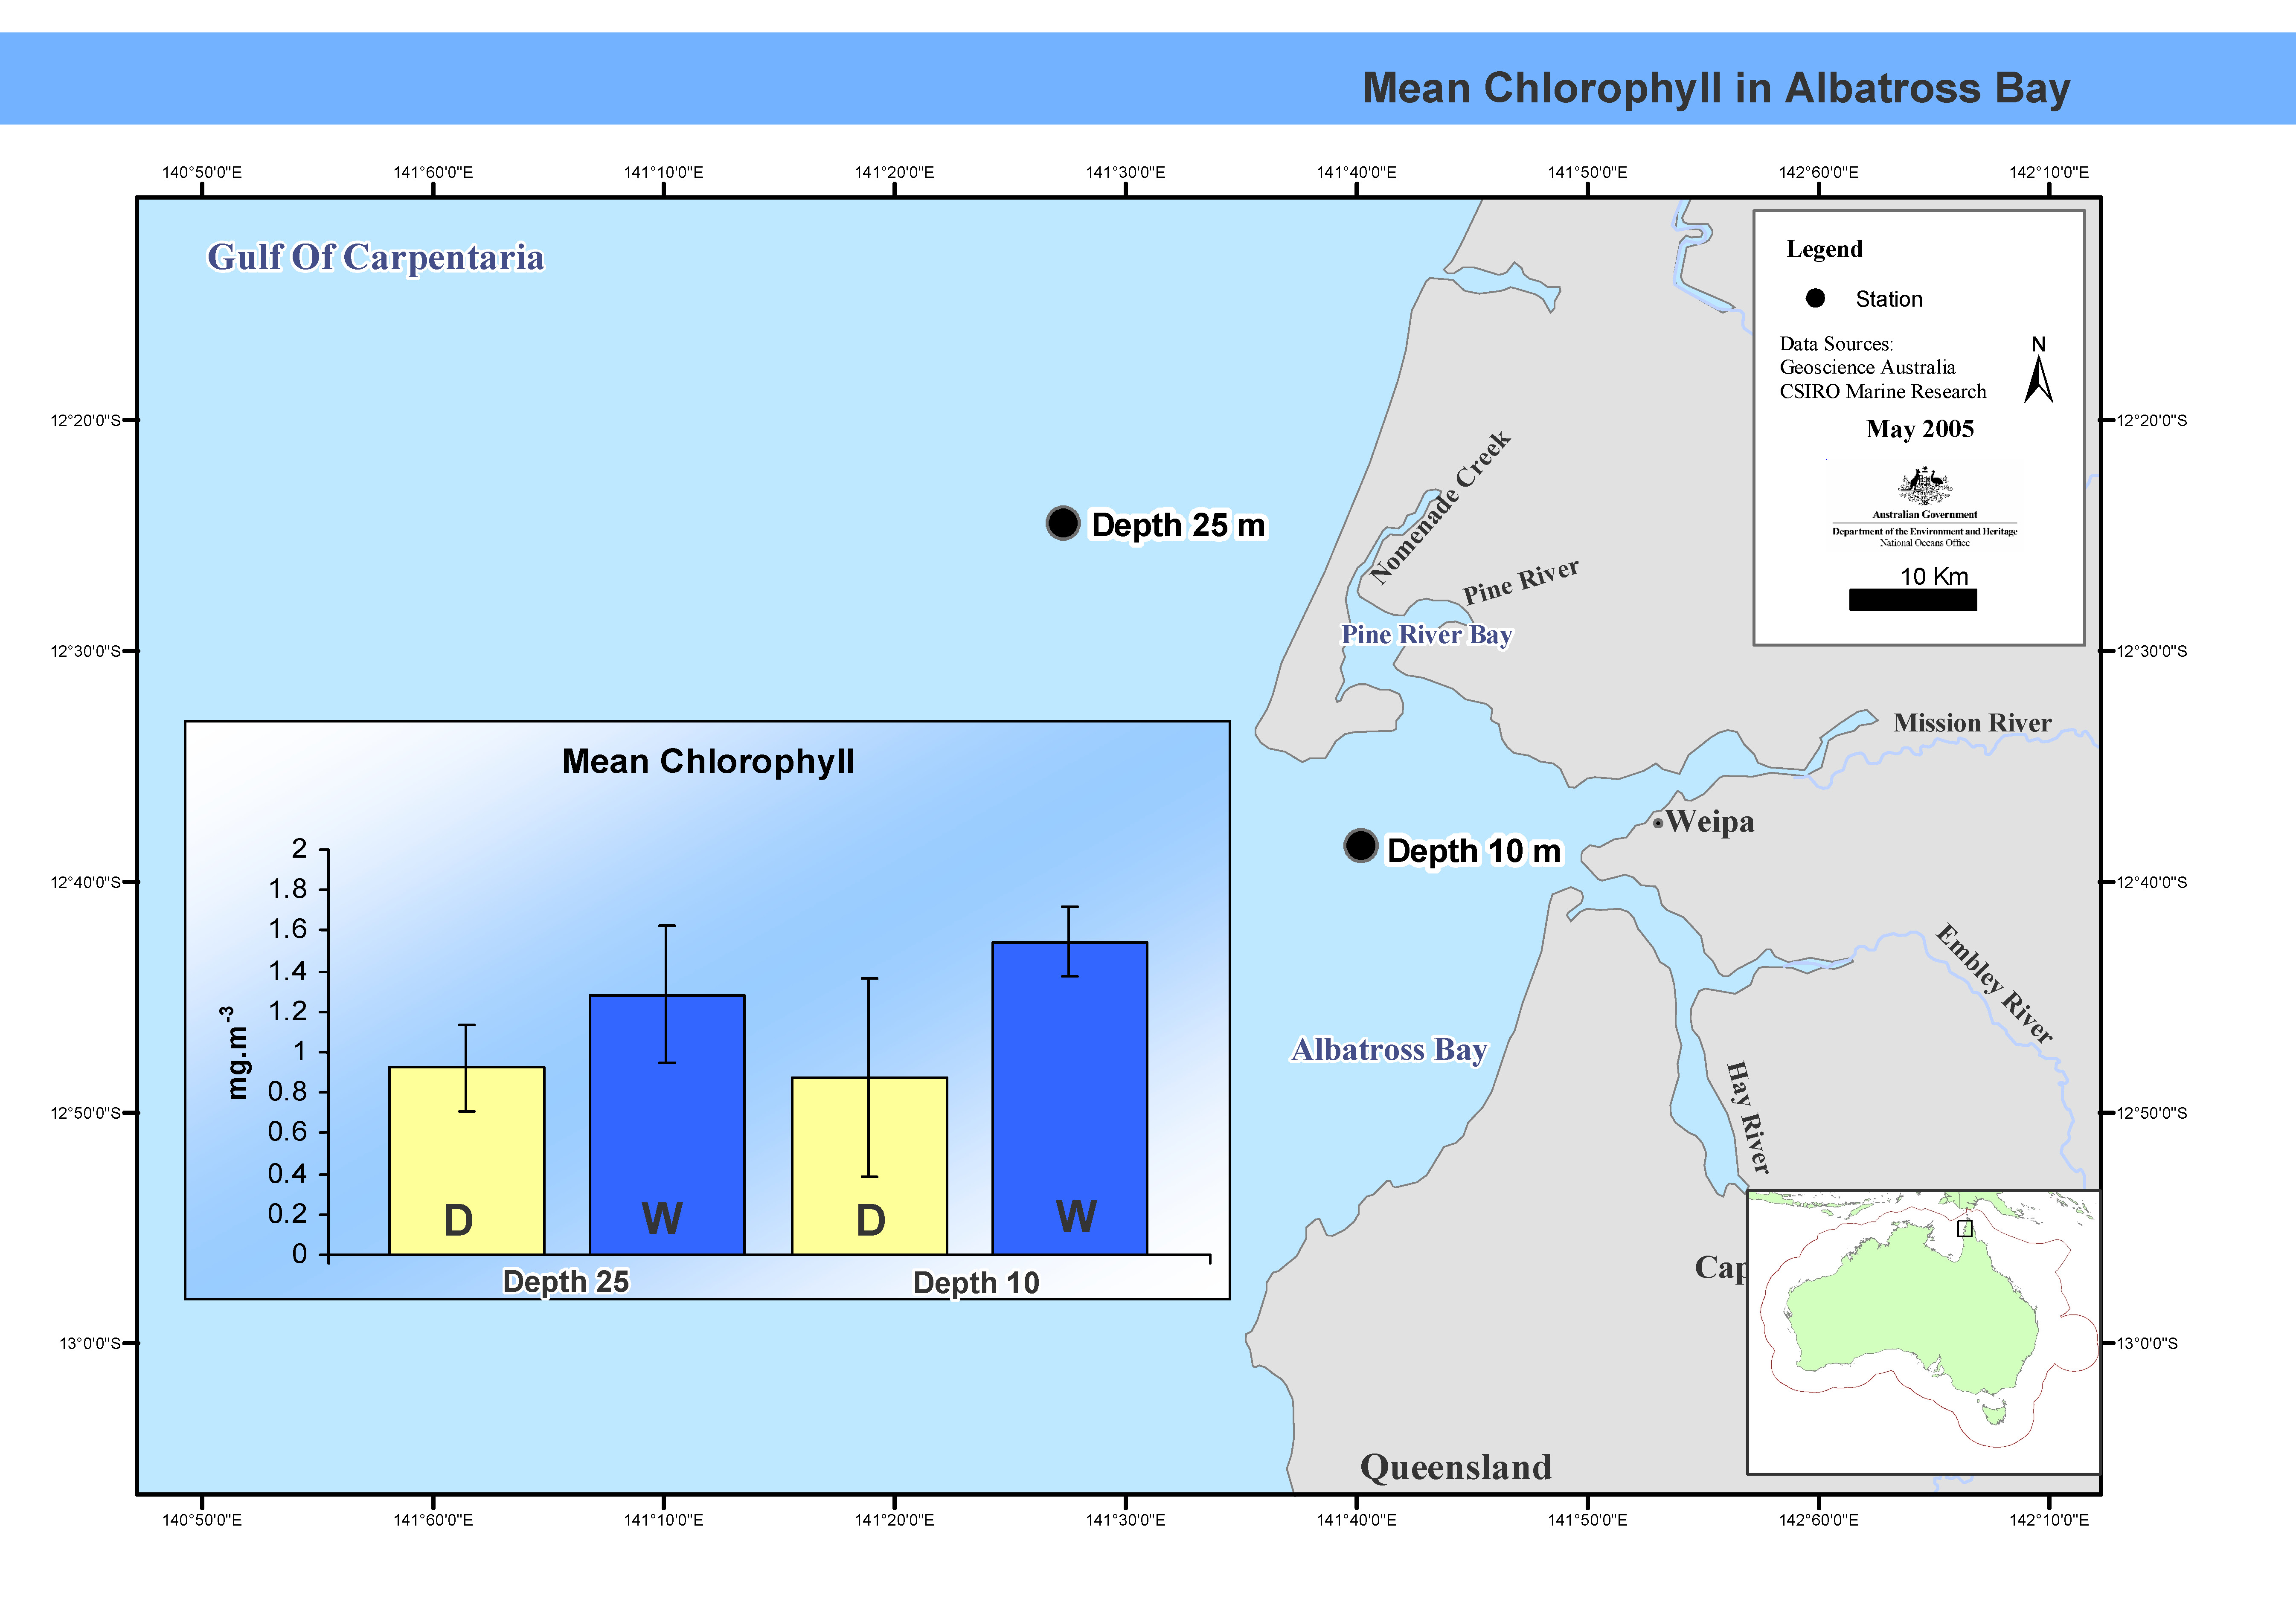
This map shows mean chlorophyll concentrations in Albatross Bay. Between February 1988 and February 1992 the FRV Jacqueline D completed nine cruises, seven in summer, two in winter, in Albatross Bay in the north-east Gulf of Carpentaria. Two stations, one 10m deep, the other at 25m, were sampled. Mean chlorophyl levels and primary productivity in the water column were measured. This map has been produced by CSIRO for the National Oceans Office, as part of an ongoing commitment to natural resource planning and management through the 'National Marine Bioregionalisation' project.
-
Between March 1986 and April 1992, monthly cruises were carried out at 21 stations in Albatross Bay, Gulf of Carpentaria. Prawn larval densities were measured and salinity-temperature profiles taken. Prawn larval density from stepped oblique bottom to surface plankton tows. Net sizes were 142 or 140 m mesh, 250 micron mesh with a 0.5 x 0.5 metre square frame, stepped-oblique tow. In this dataset Penaid prawn counts were recorded to genus level for all larval stages.
-
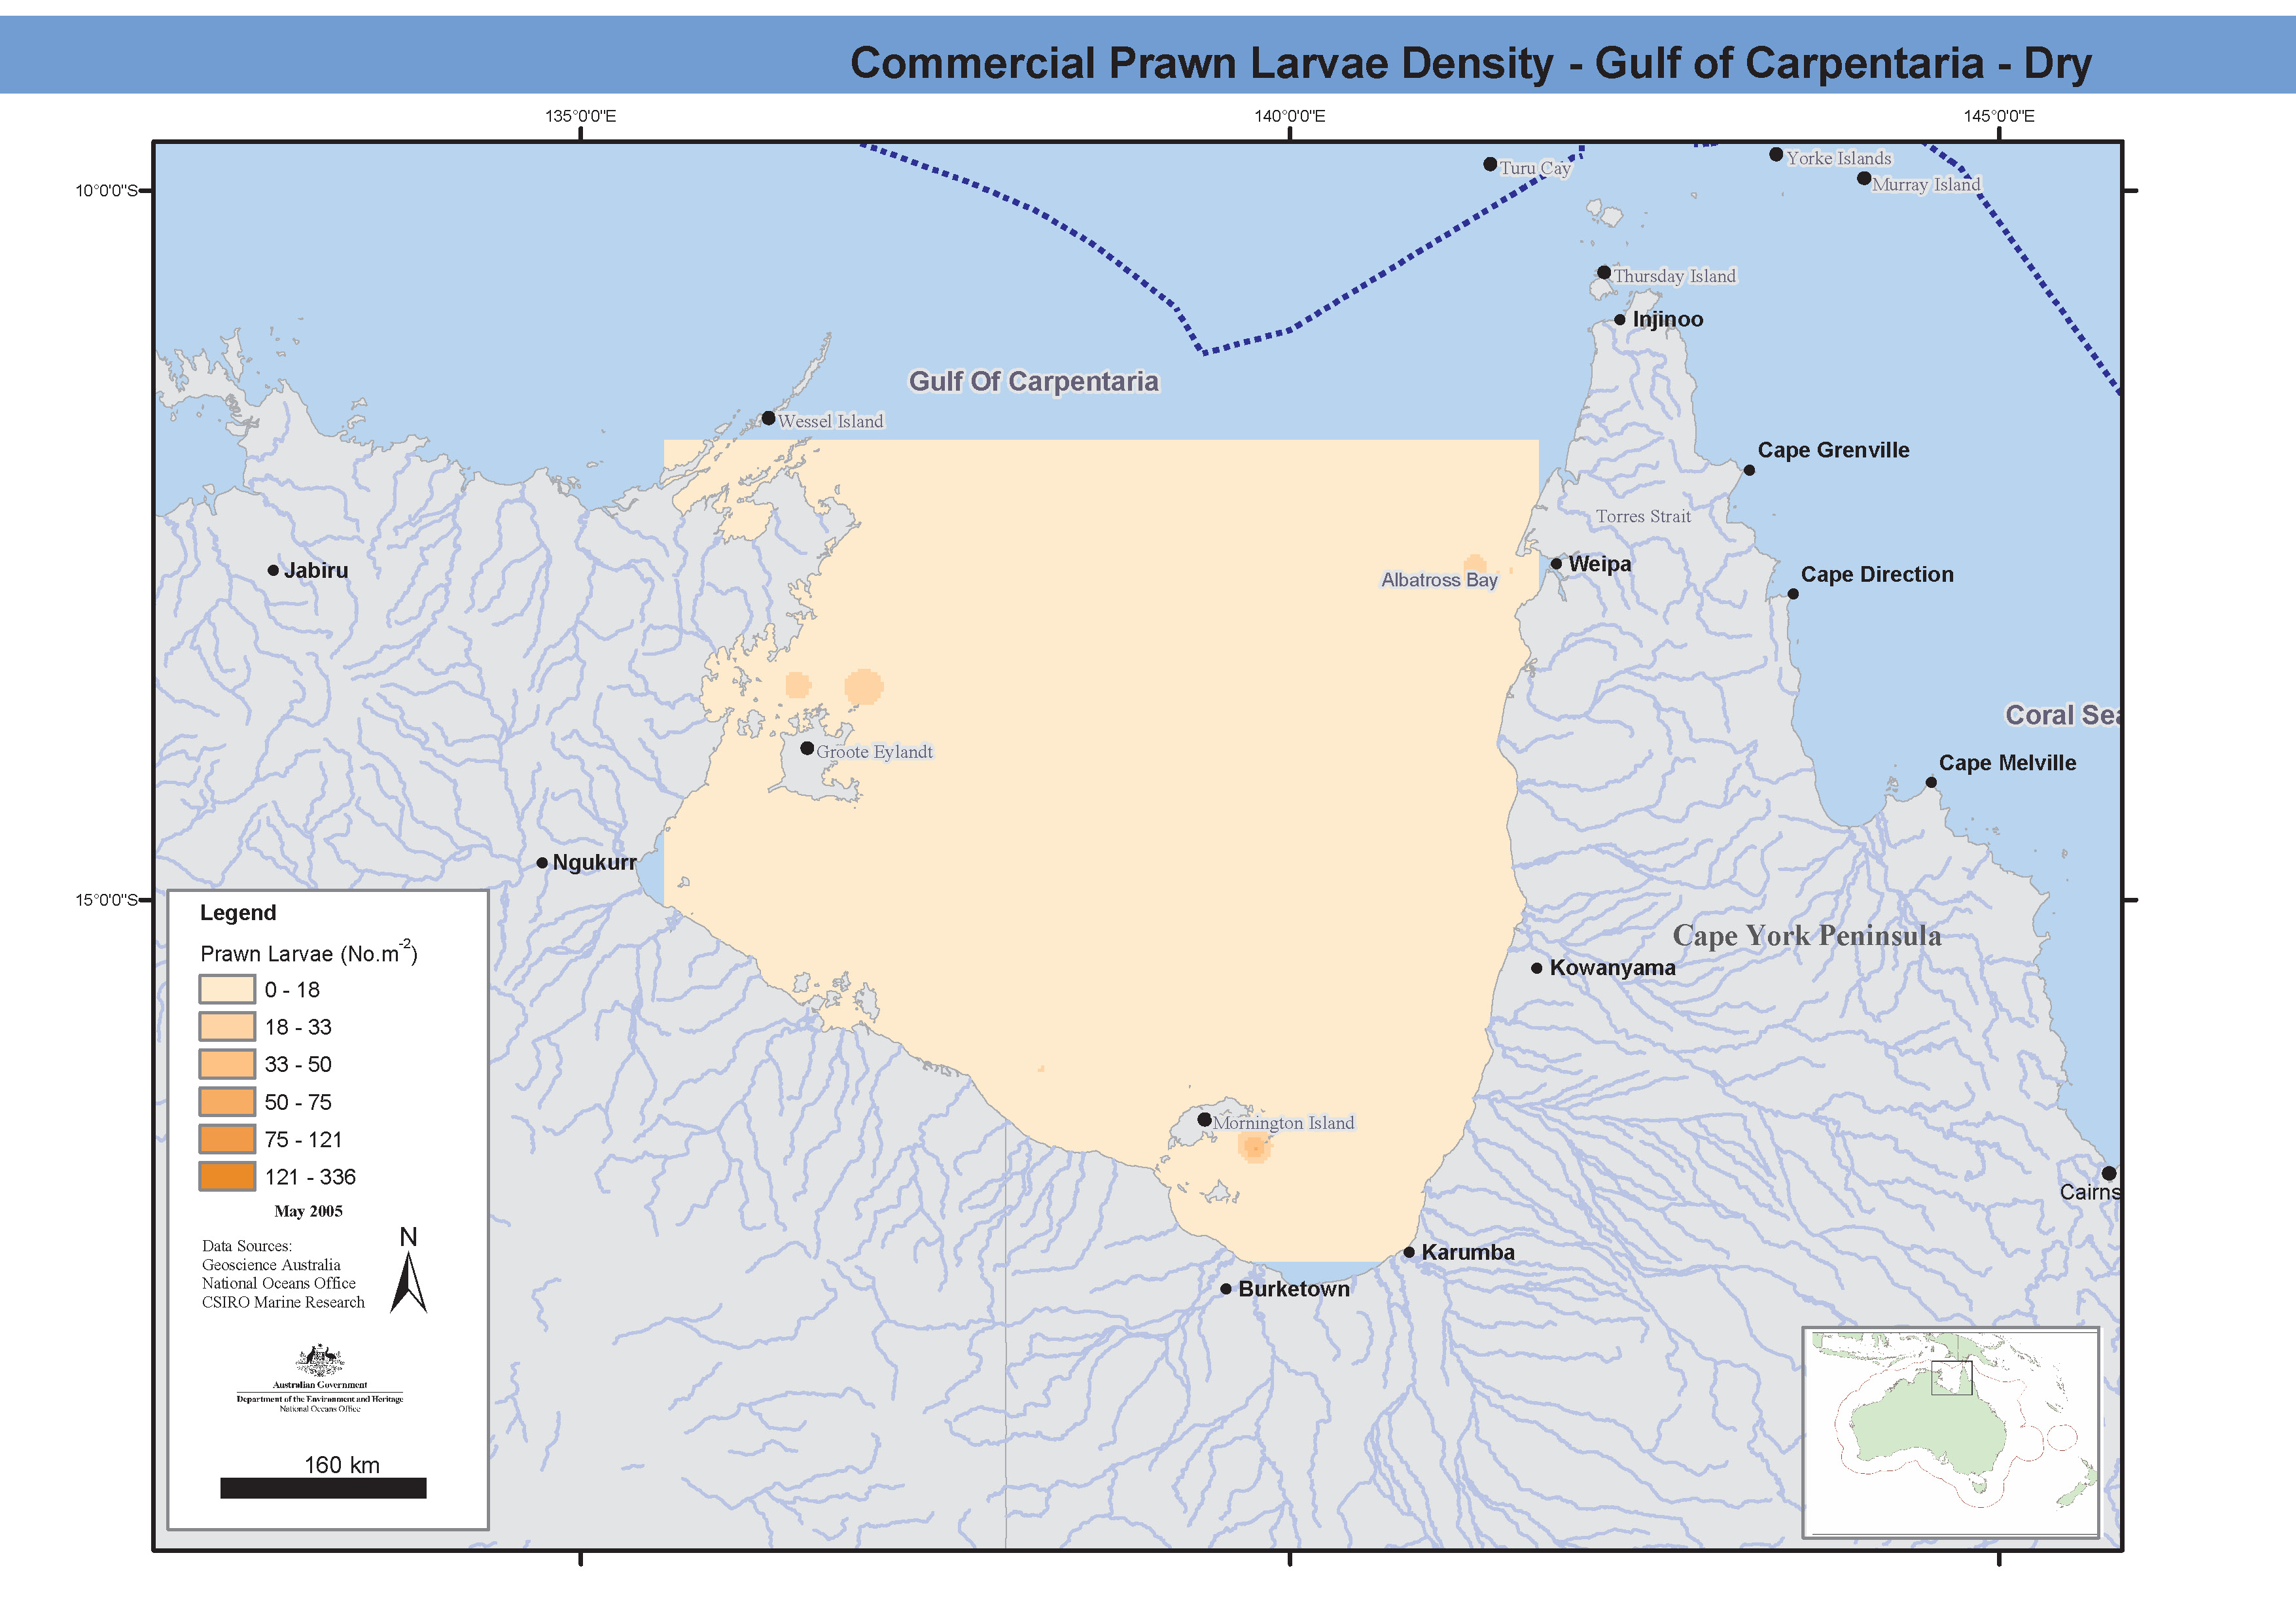
Maps showing prawn larval distribution of commercial prawn species during both the wet and dry seasons in Albatross Bay. The data was recorded from stepped oblique bottom to surface plankton tows, 140-142um nets. Nine cruises took place between 1975 and 1977 on chartered boats and the "Kalinda". Prawn larval biomass and densities were measured in several transects across the Gulf of Carpentaria, as well as total plankton biomass. These maps have been produced by CSIRO for the National Oceans Office, as part of an ongoing commitment to natural resource planning and management through the 'National Marine Bioregionalisation' project.
-
26 cruises between 1986 and 1988 recorded the biomass and species composition of tropical zooplankton in Albatross Bay, Gulf of Carpentaria, Northern Australia. The initial data analysis was undertaken by Graham J B Ross between 20 November and 15 December 1999, where a significant number of errors, of various types where discovered and correction made. See attached metadata record REPORT.TXT. Zooplankton taxonomic groups were identified to species level where possible (from m6332.xls), with a primary focus on copepods, to produce the ESRI shape layer and m6332_copepods.xls. Data is stored as mean number of individuals per site. Sampling occurred across 5 sites (Site 1 = Inshore, Site 5 = Offshore, Sites progressed westward). Temperature and salinity were also recorded for many samples.
-
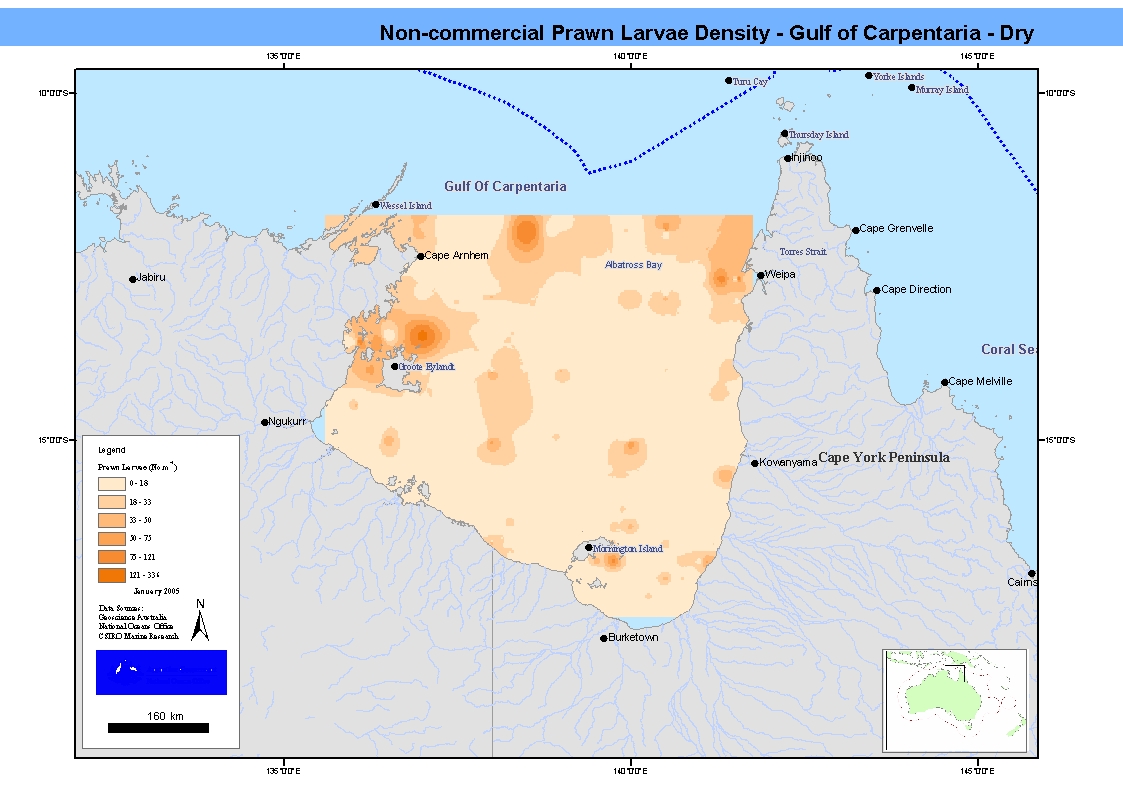
Maps showing prawn larval distribution of non-commercial prawn species during both the wet and dry seasons in Albatross Bay. The data was recorded from stepped oblique bottom to surface plankton tows, 140-142um nets. Nine cruises took place between 1975 and 1977 on chartered boats and the "Kalinda". Prawn larval biomass and densities were measured in several transects across the Gulf of Carpentaria, as well as total plankton biomass. These maps have been produced by CSIRO for the National Oceans Office, as part of an ongoing commitment to natural resource planning and management through the 'National Marine Bioregionalisation' project.
-
Data showing chlorophyll a concentrations in Albatross Bay, Gulf of Carpentaria. Phytoplankton pigment composition (chlorophyll a concentration) was measured in Albatross Bay, Gulf of Carpentaria, northern Australia. Four sites were sampled over six years between August 1986 and April 1992. In the last two years samples were taken at the bottom of the water column in addition to mid-depth. This data has been produced by CSIRO for the National Oceans Office, as part of an ongoing commitment to natural resource planning and management through the 'National Marine Bioregionalisation' project.
-
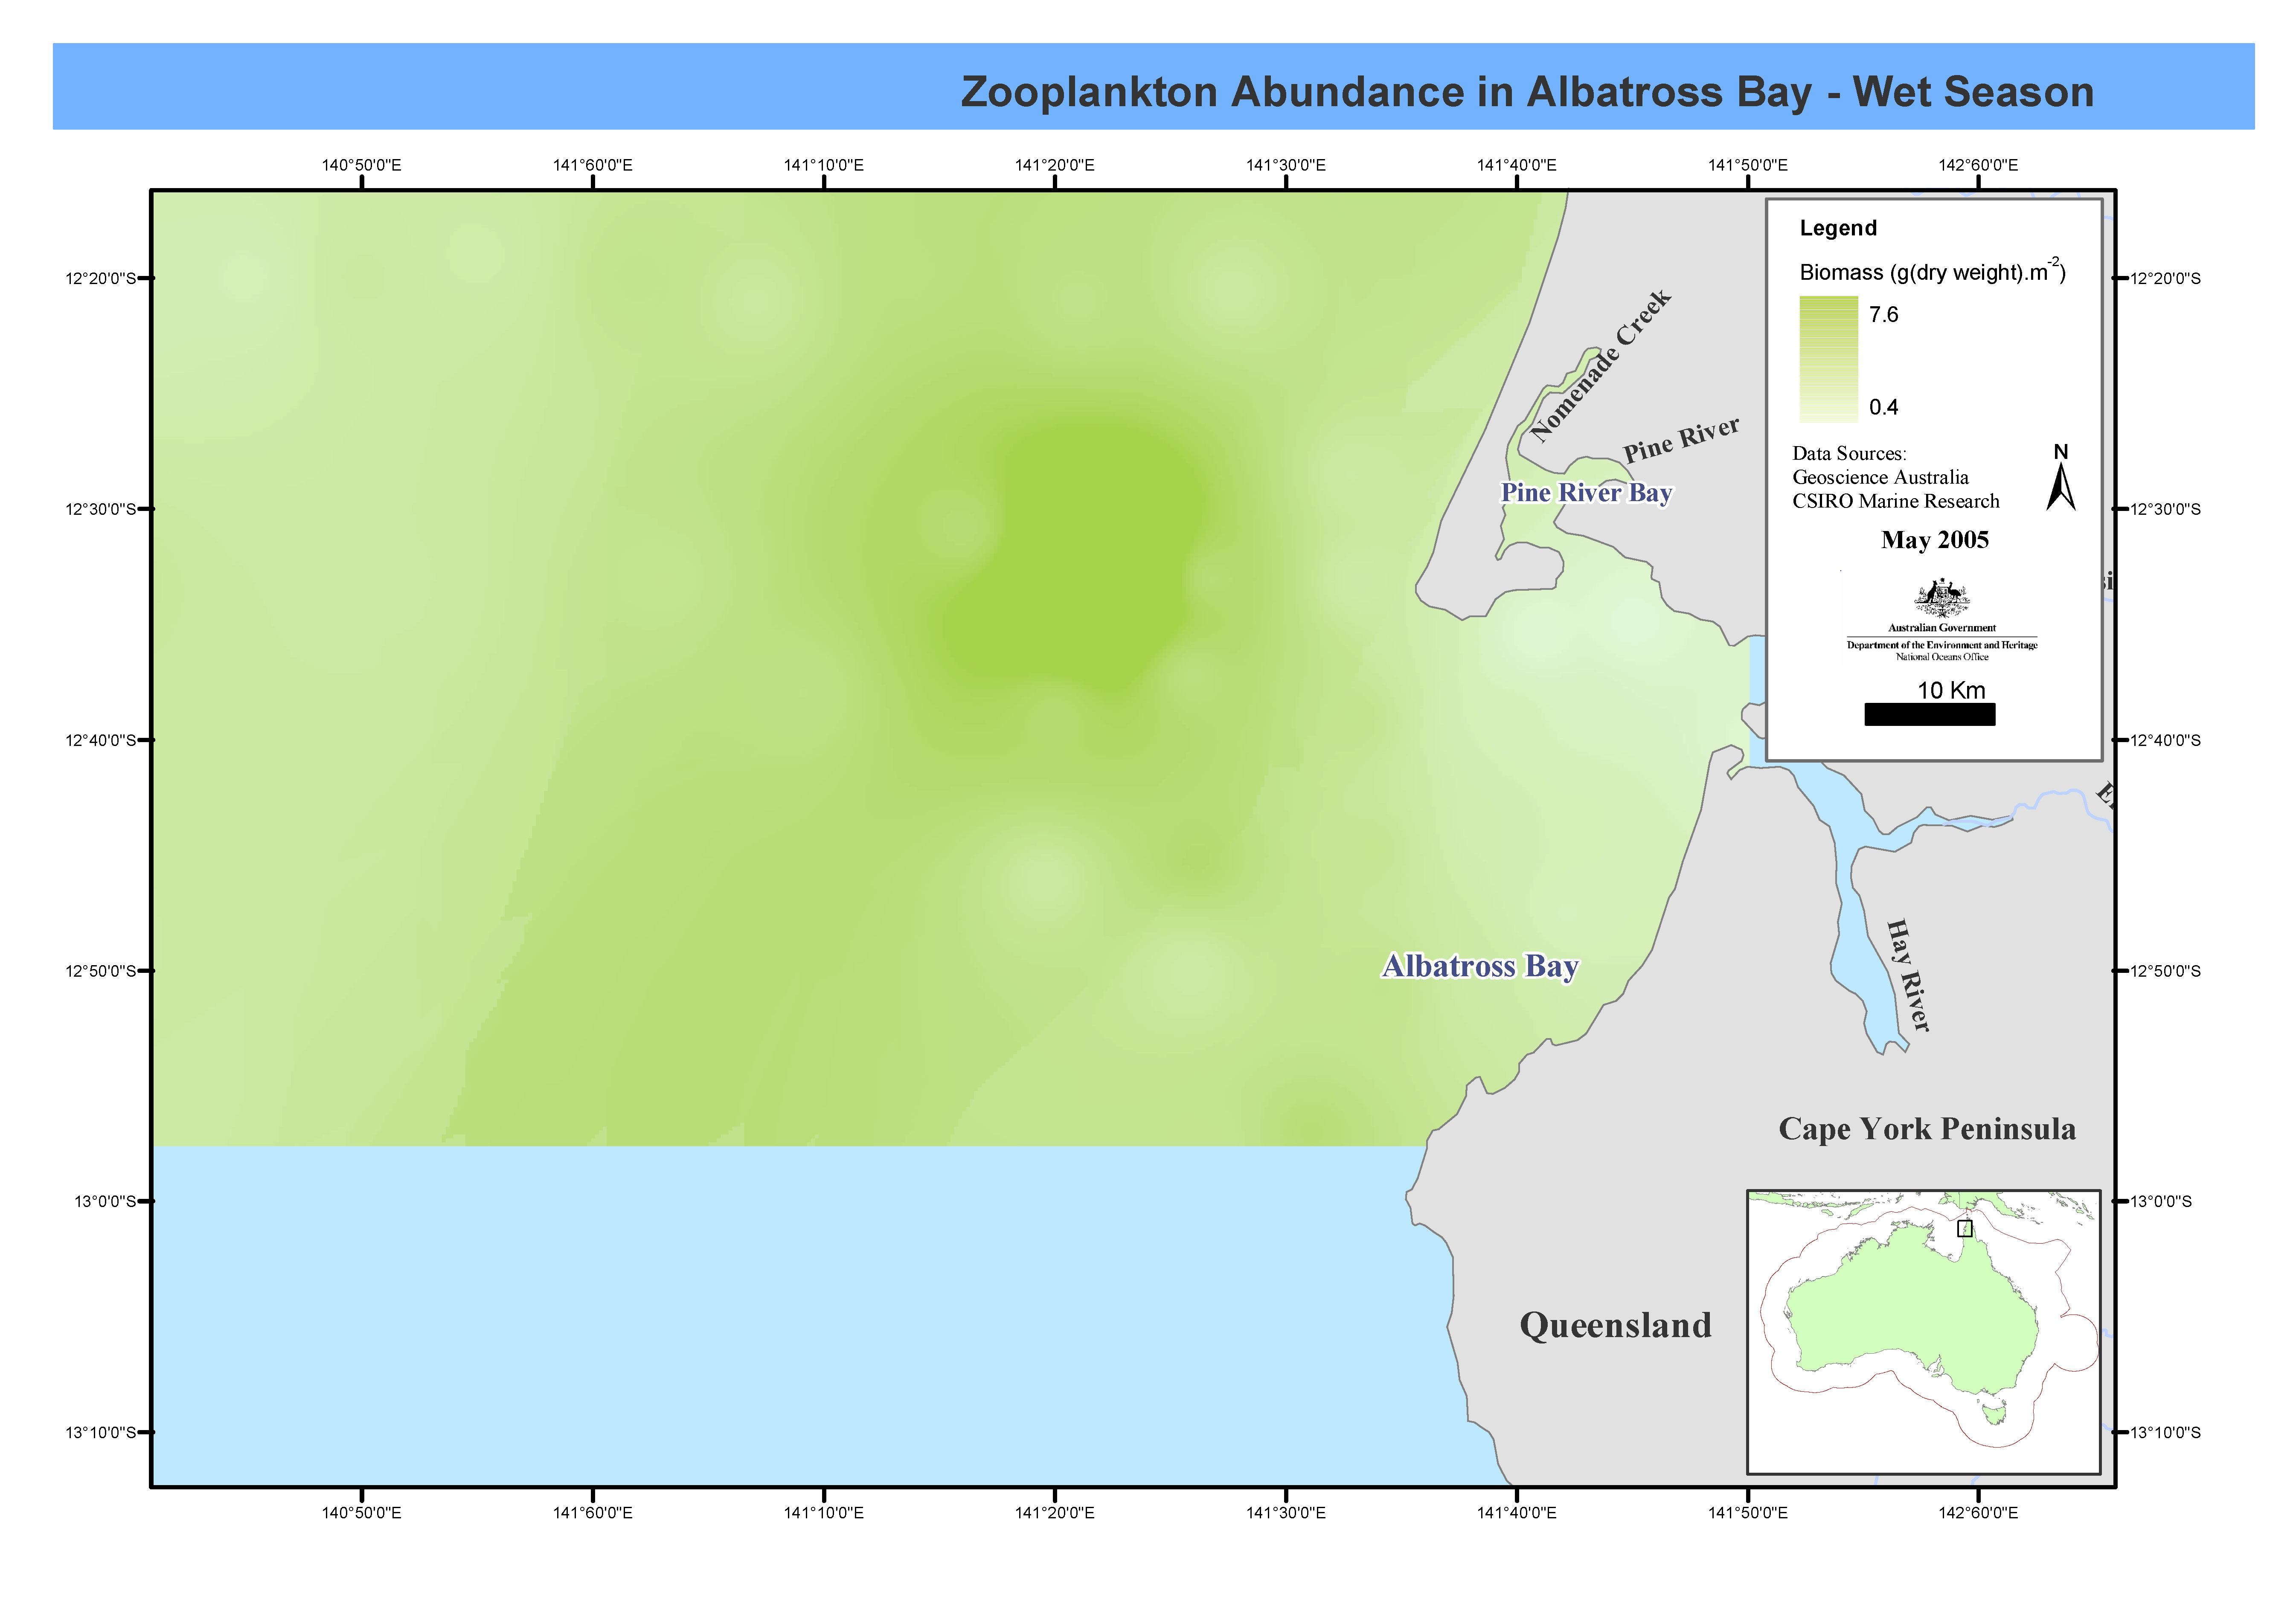
These maps show zooplankton biomass in Albatross Bay for both wet and dry seasons. Monthly cruises were carried out between March 1986 and April 1992, at twenty-one stations in Albatross Bay, Gulf of Carpentaria. Prawn larval densities were measured and salinity-temperature profiles taken. Theses maps have been produced by CSIRO for the National Oceans Office, as part of an ongoing commitment to natural resource planning and management through the 'National Marine Bioregionalisation' project.
-
Primary Productivity point data from northern Australian waters that has been mapped using MapInfo. Data collected from oceanographic surveys 1959-1964 onboard the vessels "Gascoyne" and "Diamantina". Zooplankton biomass, milligrams per cubic metre. This GIS layer has been produced by CSIRO for the National Oceans Office, as part of an ongoing commitment to natural resource planning and management through the 'National Marine Bioregionalisation' project. Variations in onscreen colour representation or printed reproduction may affect perception of the contained data.